Menu data layers
Table of Contents
- The data layers menu contains the following two elements:
The bar of maps and layers of management tools.
The tree layers of the current map.
Note
A MapMint card matches a card MapServer configuration file (mapfile)
Base Maps
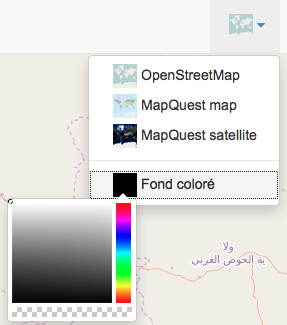
A context menu is available in the upper right of the map, to the left of the usual authentication button. It lets you choose the base map to use. By default, when you load your funds OpenStreetMap map creation module are displayed. You can either use MapQuest Map and Satelite or using a colored uniform background. In the latter case, you need to click on the colored square in the context menu to bring up the color selection tool, then select a color to display the map on this background color.
Open a map
Icon |
Action |
 |
Open a map |
To open an existing map, click on the corresponding icon on the left of the map being edited. This causes the display of the map just opening menu below. Select a project by entering its name in the text field provided for this purpose, selected the name of the map to open in the list and click the “Load” button.
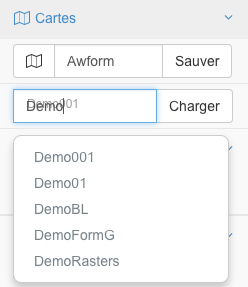
The opening of the card triggers the refresh map creation module and loading the requested map.
Save a map
To save the current map with a new name, change the name of the card in the text field provided for this purpose, then click the “Save” button.
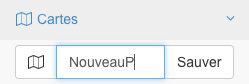
Warning
The name of a card should not contain spaces, accent or special characters
Menu layers
In making a right click on the first node of the tree ( “Layers”) layers, a context menu with the tools listed below appear.
Icon |
Action |
 |
Add one or more layers to the map |
 |
Adds a grid to map layers |
 |
Opens the order management panel layers |
Add a layer
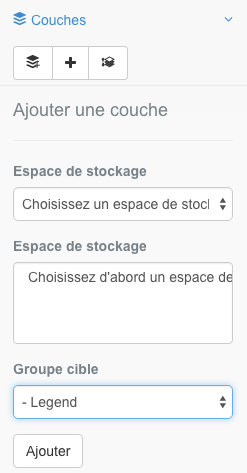
To add a new layer to the shaft and to the map, click on the “Add layer”, which will display the corresponding form as shown below.
First select a storage space in the first drop-down. This refresh the second list showing sources of data contained in the selected storage.
Then select one or more data sources, the group layer where you want it(s) appear(s) and click the “Add” button. This causes the disappearance form, module refresh and the addition of the layer to the map.
Note
Hold down the “Ctrl” on your keyboard to select multiple data sources.
Warning
If you do not select a group, the new layer will be placed at the root of the legend ( “Layers”), the layer in question will then not be visible on the large public interface. It will not be possible for the final onscreen user to set the visibility towards the layer, allowing you to force the display of certain layers in some maps. This also allows you to place the layers in the cards for applications to use some particular layers but do not want displayed on the map (where typical examples: roads in an application for calculating shortest paths, sources raster data in the case of a computational application of elevation profile ...)
Add a grid
To add a grid map (graticule), click the button “Add a grid,” which will display the corresponding form as shown below.
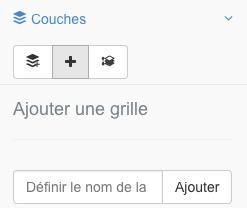
Specify a name for the grid and click the “Add” button, which causes the form are gone and the addition of the grid at the root of the tree layers. Please see the section on setting panel layers to parameter the style of the grid.
Note
Once created, the grid has the same settings tool than the other layers, accessible by right-clicking the shortcut and a layer menu.
Manage the order of layers
To manage the order of the layers on the map, click on the “Manage the order of layers,” which will open the corresponding panel as shown below.
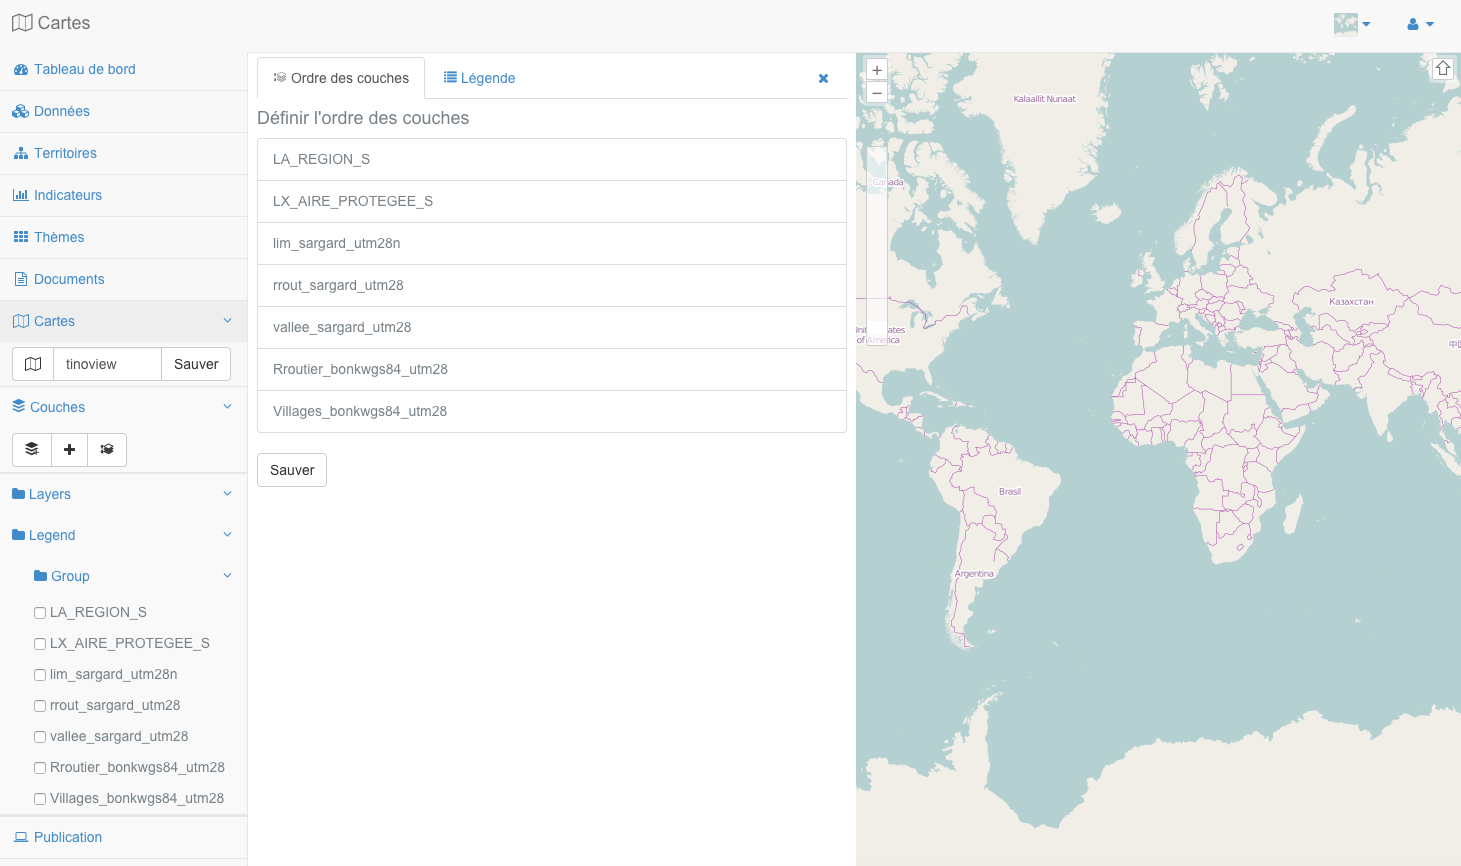
The panel has two tabs, the first in the list of layers present on the card are listed in order of opening. You can then move a layer by holding your mouse cursor pressed on the layer name and then operating a drag to the desired spot. Then click the “Save” button, which causes the actual change in the order of layers.
Note
The last layer is added to the map above all others. The uppermost layer in the list of ordered layers of the panel and the lowest when the superposition layers for display on the map.
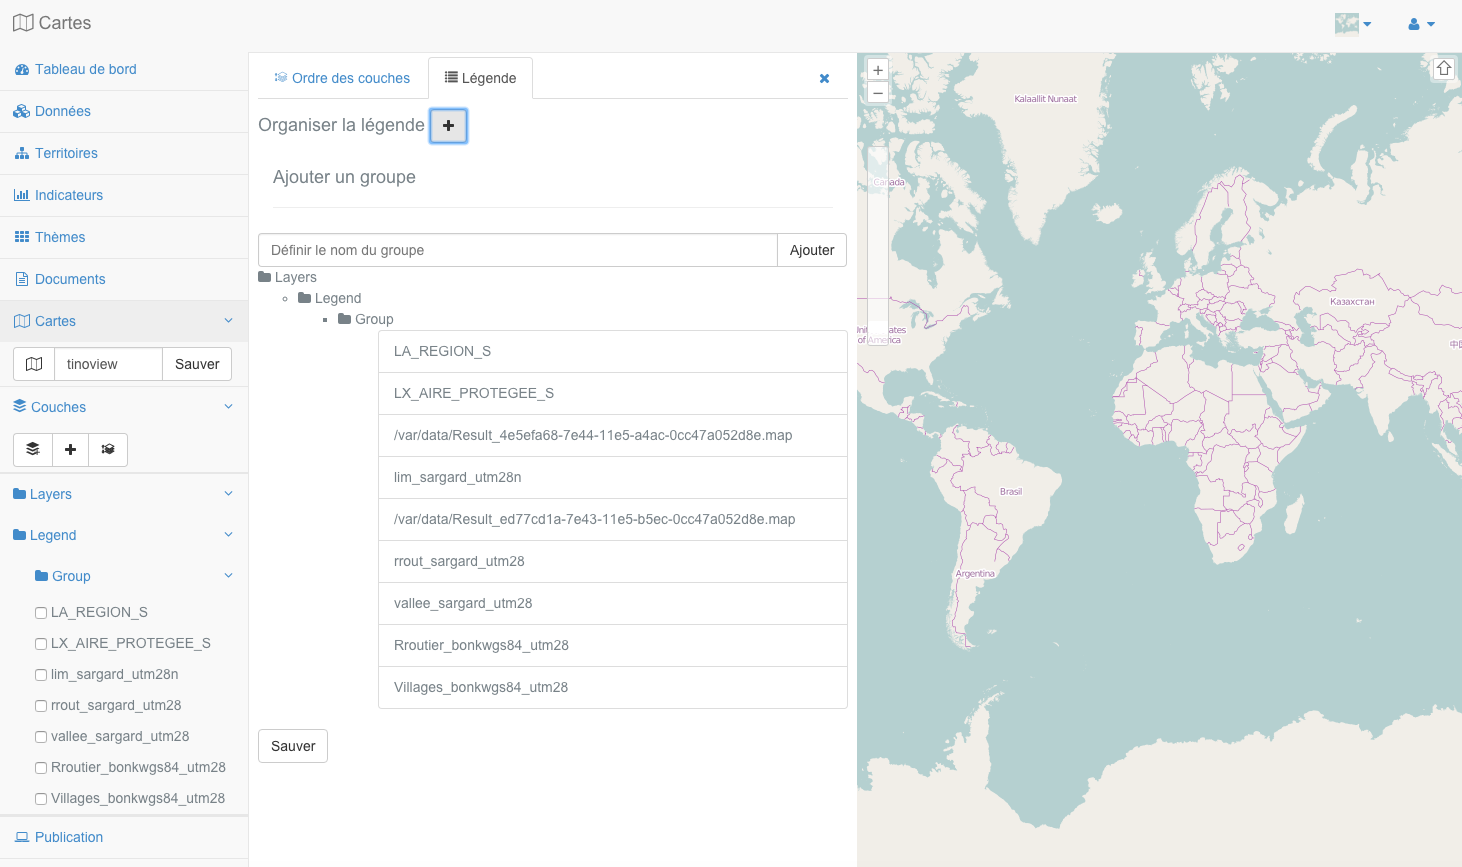
In the second tab, you can manage the map legend. You can, in the same way as before re-order the layers within a group, re-order the group or add a group as presented in the section.
Warning
It should be noted here that the order within a group or sequence of groups them has no effect on the display order of layers. This is only the display of the tree and not the order of the layers that is attached to it in the first tab.
Add Group
To create a new group layer, right click on the first node of the tree and then click “Add Directory” which will open the corresponding window.
Specify a name for the group layer.
Note
The group name is used in the legend of the published map. You can edit the name using its context menu.
Context menu for a layer
When you click on a layer with the right mouse button you see the menu appear then a layer.
Icon |
Action |
 |
Zoom map the geographic extent of the layer |
 |
Open the window containing the attributes of the layer table |
 |
Opens the edit panel of properties of the layer |
 |
Delete Layer |
Zoom to layer extent
To zoom in on the geographic extent of a layer, right click on the layer name and click on “Zoom”. This results in refocusing map the extent of the layer in the document pane to the right card.
Open the attribute table
To open the attribute table of a layer, click the right mouse button button on the layer name and click “Table” in the context menu. This causes the opening of the presentation of the data table panel, as shown below:
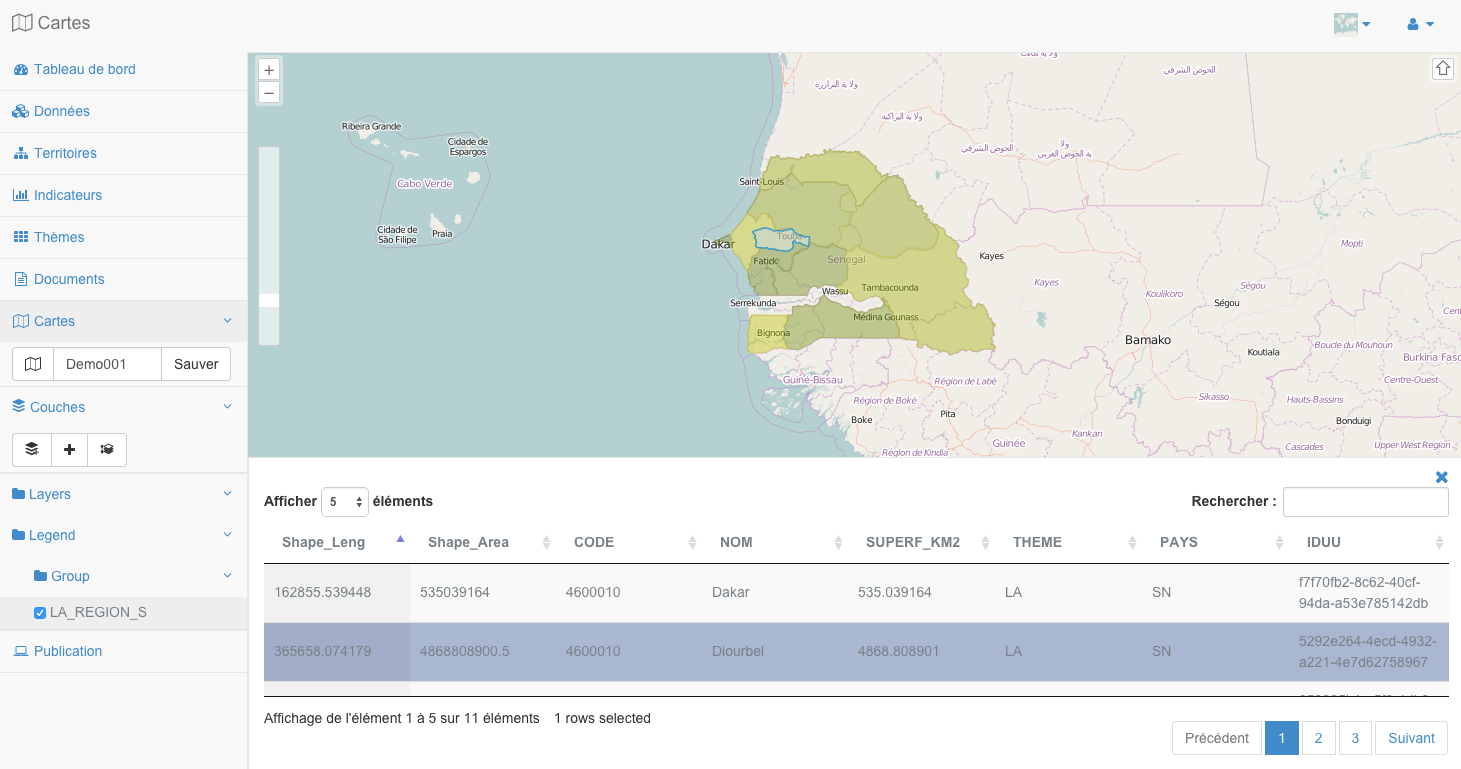
When you click on a table row, this geographical unit is highlighted on the map.
Note
Use the bottom of the table buttons to navigate through the table pages
Note
You can control the number of entities displayed per page using the drop-down list for this purpose
Configuring a layer
General properties of a layer
To view or edit the properties of a layer, right click on the layer name and click “Properties.” This will open the Properties window of the layer, as shown below:
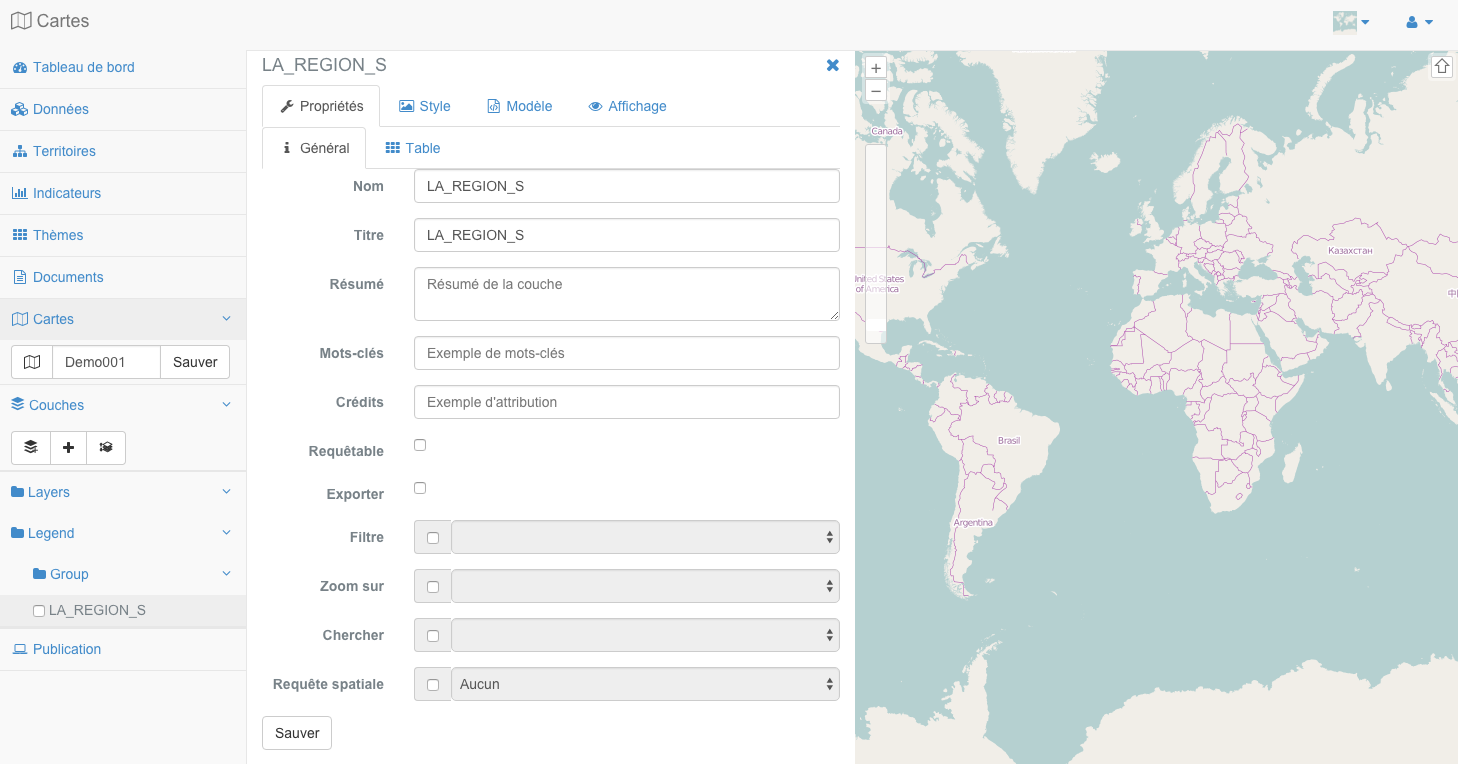
The properties of a layer are listed in the table below:
Property |
Definition |
Name |
Name the layer (the layer name in the map file) |
Title |
Title of the layer |
Summary |
Description of the layer |
Keywords |
Keywords of the layer |
Credit |
Copyright, property, or award costs on the layer |
Request |
Possibility to use the layer with the selection tools |
Export |
Possibility to use the layer with export tools |
Filtered |
Possibility to use the layer with the filter tools |
Zoom to |
Possibility to use the layer with the entity zoom tools |
Look up |
Possibility to use the layer with the search tools |
Spatial queries |
Possibility to use the layer with spatial analysis tools |
Layer Name
This is the mom of the default layer (equivalent to the name of the data source). Changing this value is optional and does not affect the layer name in the published map. It changes the name of the layer in the mapfile only.
Title of the layer
This is the layer name as it will appear in the legend of the published map.
Note
The title of the layer can be changed at any time, even when the published map
Description
Enter a string describing succinctly layer.
Keywords
Enter words describing the layer. These must be separated by commas.
Credit
Enter a string describing the source of the data used by the layer. This may be the name of the organization that creates the data, intellectual or commercial property, but also the allocation and/or its license.
Request
Check this box if you want to use the selection tools with this layer in the published map.
Warning
A layer must be declared queryable for the selection features work properly for the layer in the published map
Export
Check this box if you want to use the export tool with this layer in the published map.
Warning
A layer must be declared as exportable for the export features work properly for this layer in the published map
Filtered
Check this box if you want to use the zoom tools with this filter layer in the published map.
Warning
A layer must be declared to be filtered so that the filter features work properly for this layer in the published map
Look up
Check this box if you want to use the search engine with this layer in the published map.
Warning
A layer must be declared as “echerchable for the layer appears in the search of the published map
Note
All layers declared as searchable appear in the drop-down list of the search engine of the published map
Spatial query
Click this box if you want to use the tools of analysis and spatial query with this layer in the published map.
Setting the table display
The Setup tab of the table display to define how the data will appear in the published application when the user will use a data selection tool.
The settings are made using the form provided below. It displays each column of the table as a line and allows you to define several parameters of table display in the published application.
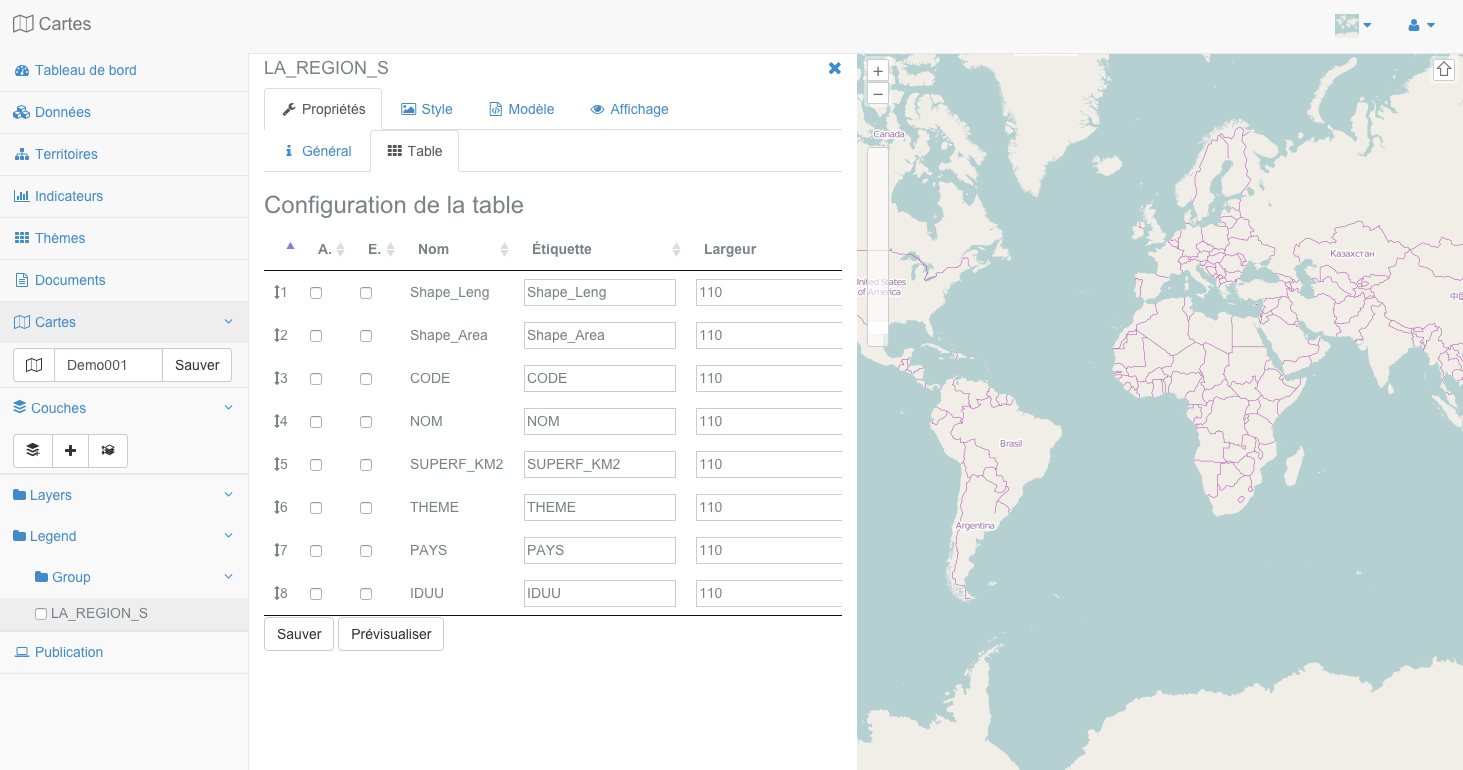
If you click on the icon to the left of the line number, you hold the button on your mouse and you move the mouse cursor up and down or basic top, you can define the display order of columns.
For each column, thus corresponding to a line of the form, you can set:
if the column should be displayed (or not) by checking (or not) the box in column “D.” form,
if the column should be contained in the downloaded data by the user (or not) by checking (or not) the column box “E.” form,
title to be displayed in the published application to the column with the column field “Label”
the width (in pixels) of the column in the table with the column of field “width”.
Note
If you view the table at the same time as setting panel of the table display and attribute table, you can set the table directly then resizing tool to define its gains in relation to the display you want.
Warning
The table display area in the card management module is much smaller than that used in the published application. Thank you to consider sufficient sizes for your columns, even if they do not appear completely in this module.
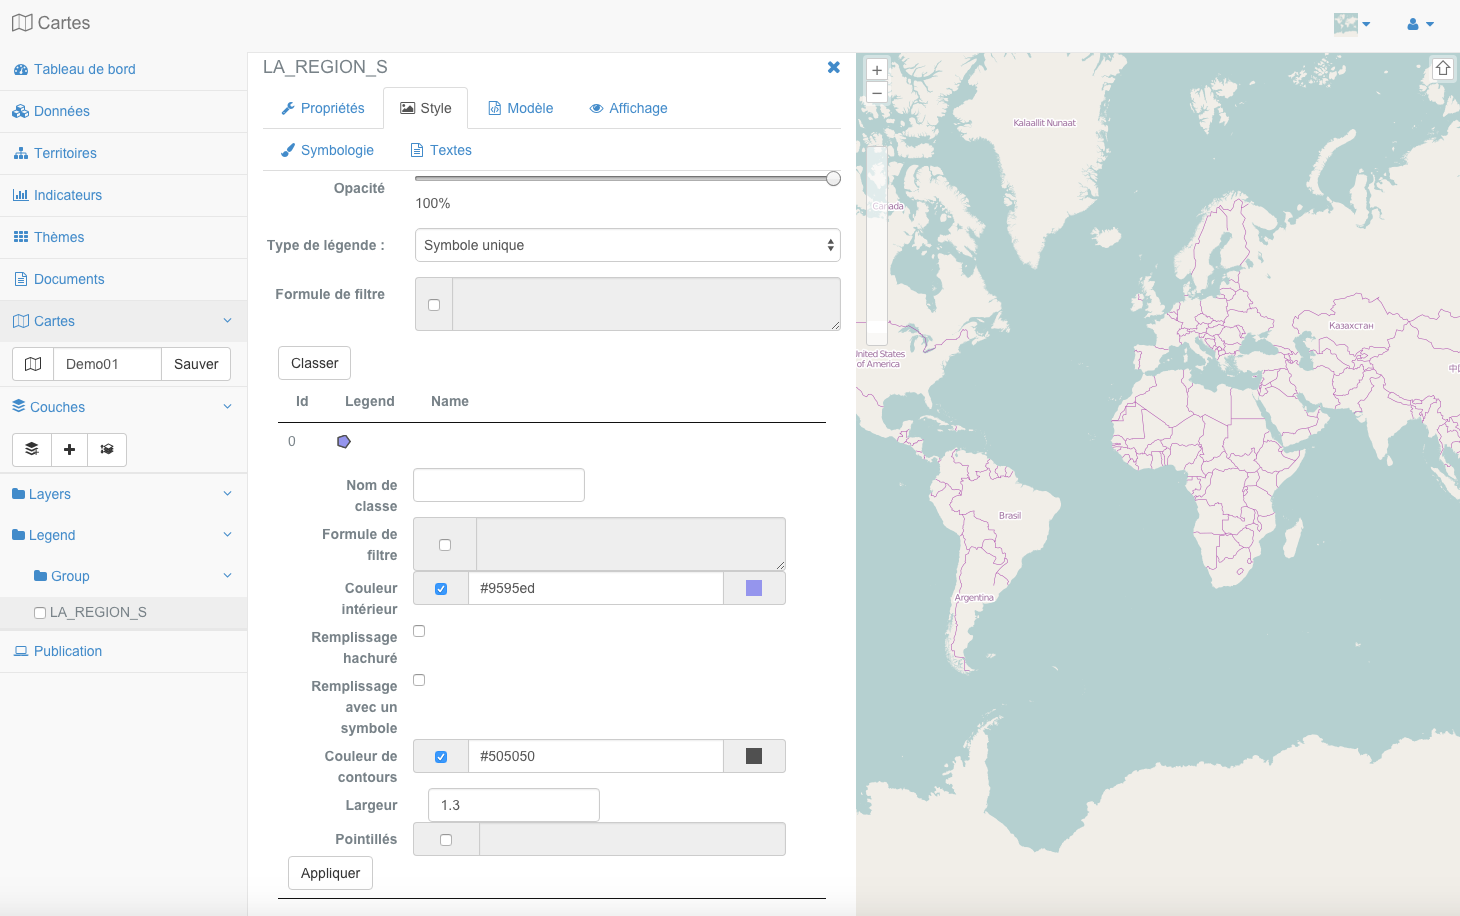
Layer style
The content of the configuration tab style and options vary depending on the type layer.
Warning
The style of the film and the icon used in the final card when issued.
Note
The style parameters match the properties CLASS, and STYLE SYMBOL mapfile of MapServer . See the reference documentation<http://mapserver.org/mapfile/index.html>`__ for more information.
The possible settings are listed in the table below and detailed in the respective subsections.
We illustrate our point with the example of setting the style of a type of vector layer polygon , setting a type layer line is comparable.
Parameter |
Action |
Opacity |
Changes the opacity of the layer |
Type of legend |
Select a type of legend for the layer |
Filler expression |
Select features using an expression |
Name |
Sets the name of the class |
Filling |
Sets the fill color of the layer |
Filling with a symbol |
Defines that the filler of the layer must be made with a symbol |
hatch fill |
Sets the layer should appear hatched (weft) |
border |
Sets the border color of the layer |
border model |
Setting the display of the edge of the layer |
Width |
Sets the border thickness of the layer |
Legend |
Displays the icon of the style sets |
Opacity
Move the slider button to set the transparency of the layer. This value in% defines the transparency of the layer in the final map (i.e in the map file).
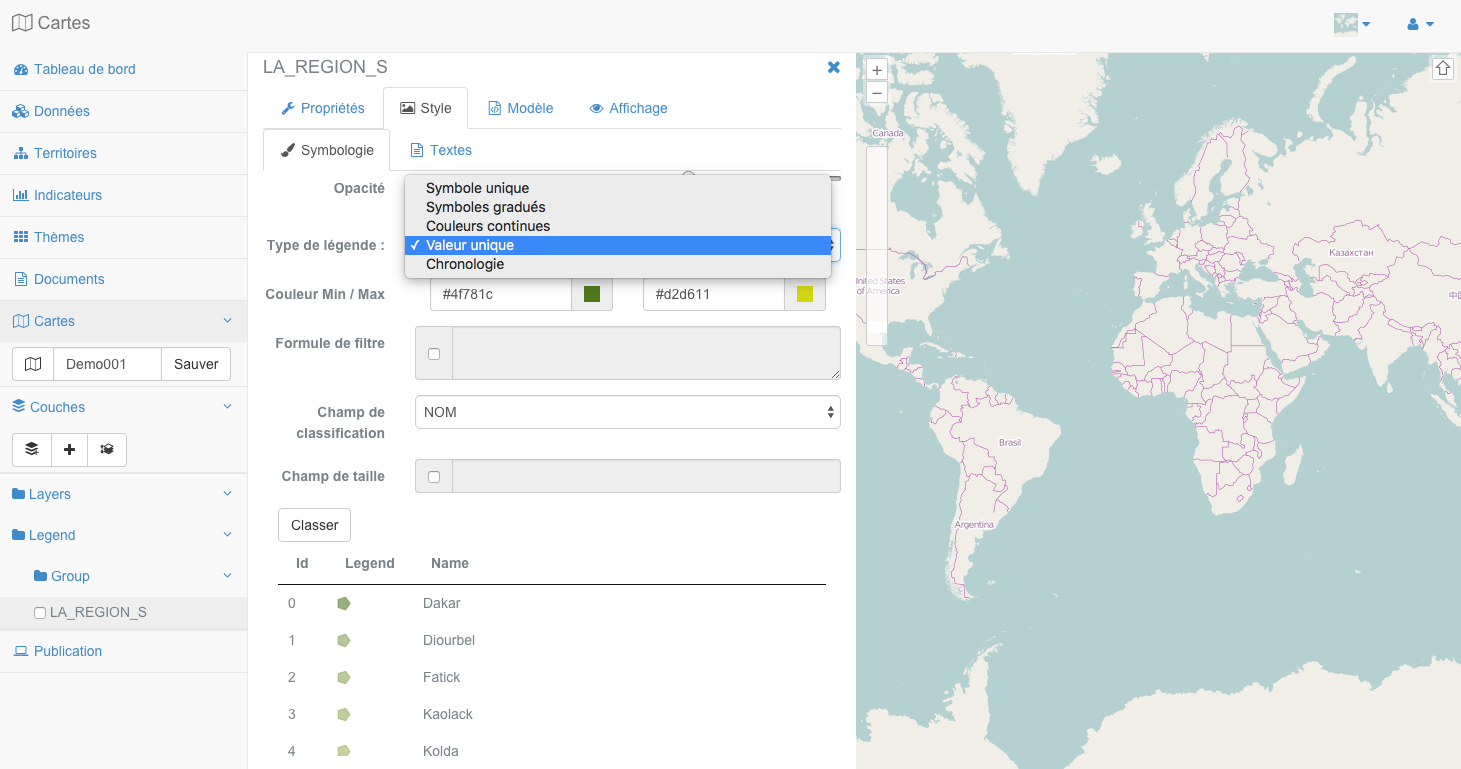
Type of legend
Select one of legend types available using the drop-down list for this purpose.
If you use a different type of legend “Single Symbol”, you will have the opportunity to individually edit each generated classes. To do this, simply click on the corresponding line to the class you want to change.
Note
Inside a class, all features are drawn with the same symbol and / or the same fill color and border.
In the case of a type classification unique value each quantitative value of the variable (an attribute field) is defined by a class. After classification, the user gets as many classes that there’s different values in the attribute field.
In the case of a graduated **symbols ** ** type of classification or continuous color ** it is possible to use a method of quantification of data. R statistics booksellers is implemented to perform such classifications.
Warning
The types of classification graduated symbols ** and continuous color ** can be used with integer fields or flotants numbers. They should not be used with a field of type character string for example.
In the case of a type of classification ** ** graduated symbols, the values of the variable are grouped into a number of classes ordered by the field value used to perform the classification.
n the case of a type of classification **color continuous ** , quantitative values of the variable are grouped into a number of classes and a color gradient and used to assign a color to a generated class.
n the case of a type of classification **time series ** , the three types of classification previously defined can be used in an “stages” corresponding to different classifications that you define (for each step created). You can select or add a step using the drop down list provided for this purpose. The classification should then be set for each of the added steps. Each step has a legend is his own. In the published application, the layer will appear with a legend whose legend and display on the map varies over time.
Note
The use of a time series type classification generates adding interactive temporal frieze in the final map for moving from one stage to another.
After all filled settings, click the “Sort” button. This entails defining classes and displays the résulat in the table of classes just below the pressed boutton.
Each class can then be changed manually by clicking on the corresponding line in the table of classes. This causes the display of the editing of a class form, shown below.
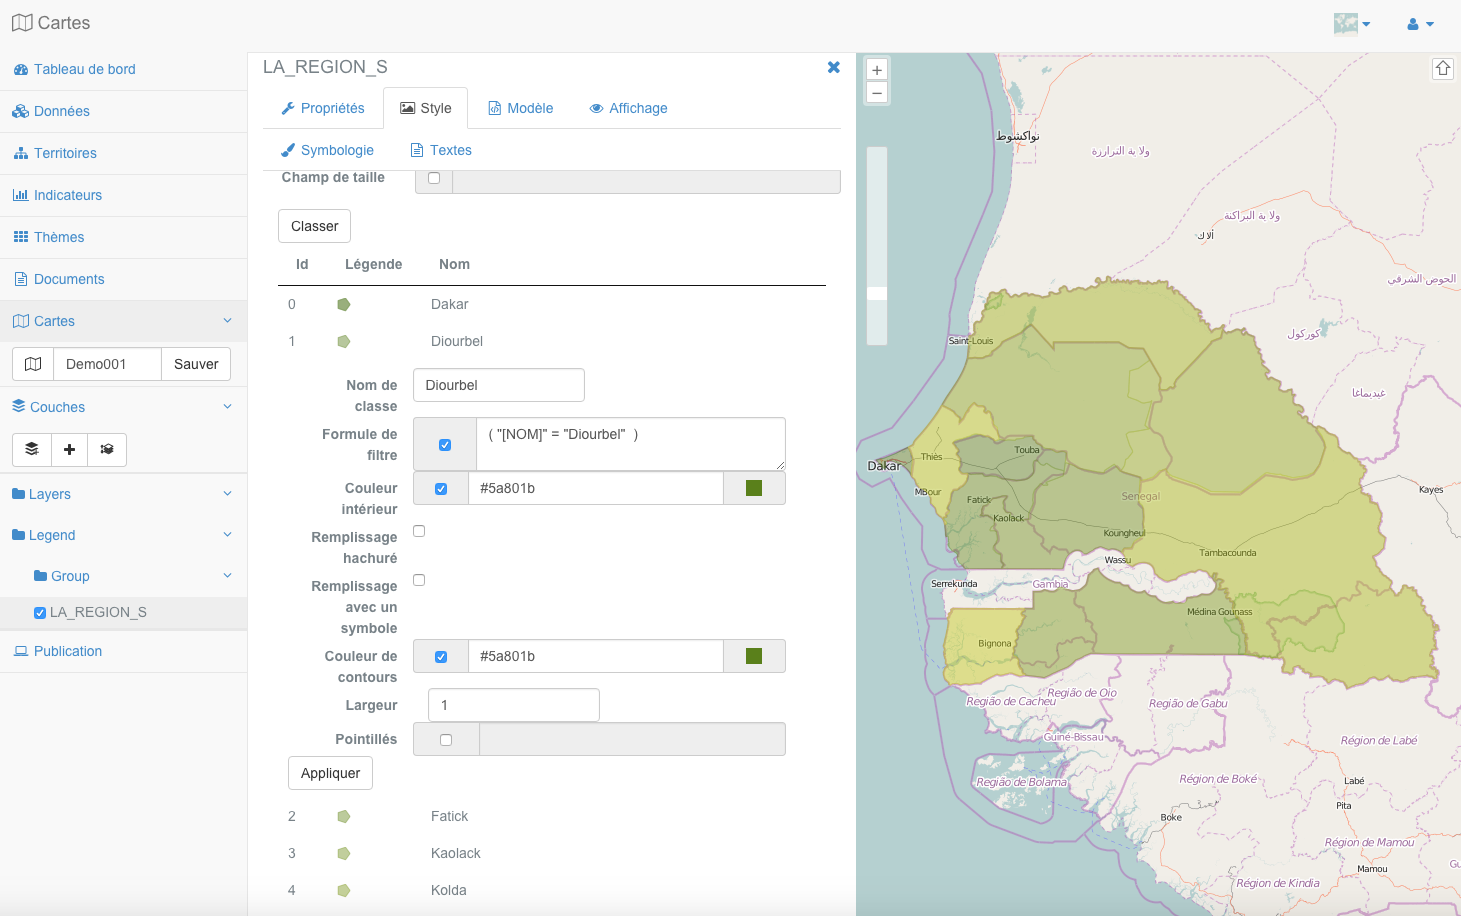
The name , the limit values and the different filling options and border can be changed. Click the “Apply” button at the bottom of the window to save the changes. This results in changing the Class in the table of classes.
Name
The text field specifies the name of the class, the class name is displayed in the published application, it is important to assign a relevant value.
Filler expression
Checking this box causes the activation of the text box containing the logical expression of the classification (ie the parameter “expresssion settings” of the layer in the map file). This area allows you to adjust your classification and limit values of classes
Note
You can also use the filter to the classification level setting if you want to filter data to classify.
Filling
- It is possible to define a filling layer with:
A color (select a predefined color or adding a hexadecimal color code)
A symbol (a symbol selection from the list of activated symbols, colors inside and outside, symbol size, border width, jump between symbols)
A hatched frame (setting of the angle, size and thickness of hatching).
border
- It is possible to define the attributes of the boundary layer, with:
A color (select a predefined color or adding a hexadecimal color code)
A thickness (e.g., with the value 1.5)
A dashed border model (eg with the value 4.0 2.0 4.0 2.0)
Once all the parameters filled in, click the “Apply” button. The icon of the legend is instantly generated and displayed at the bottom of the window.
To change the style of a type of vector layer ** points** , the procedure is the same as explained for lines and polygons, the paramétrafe form is shown below:
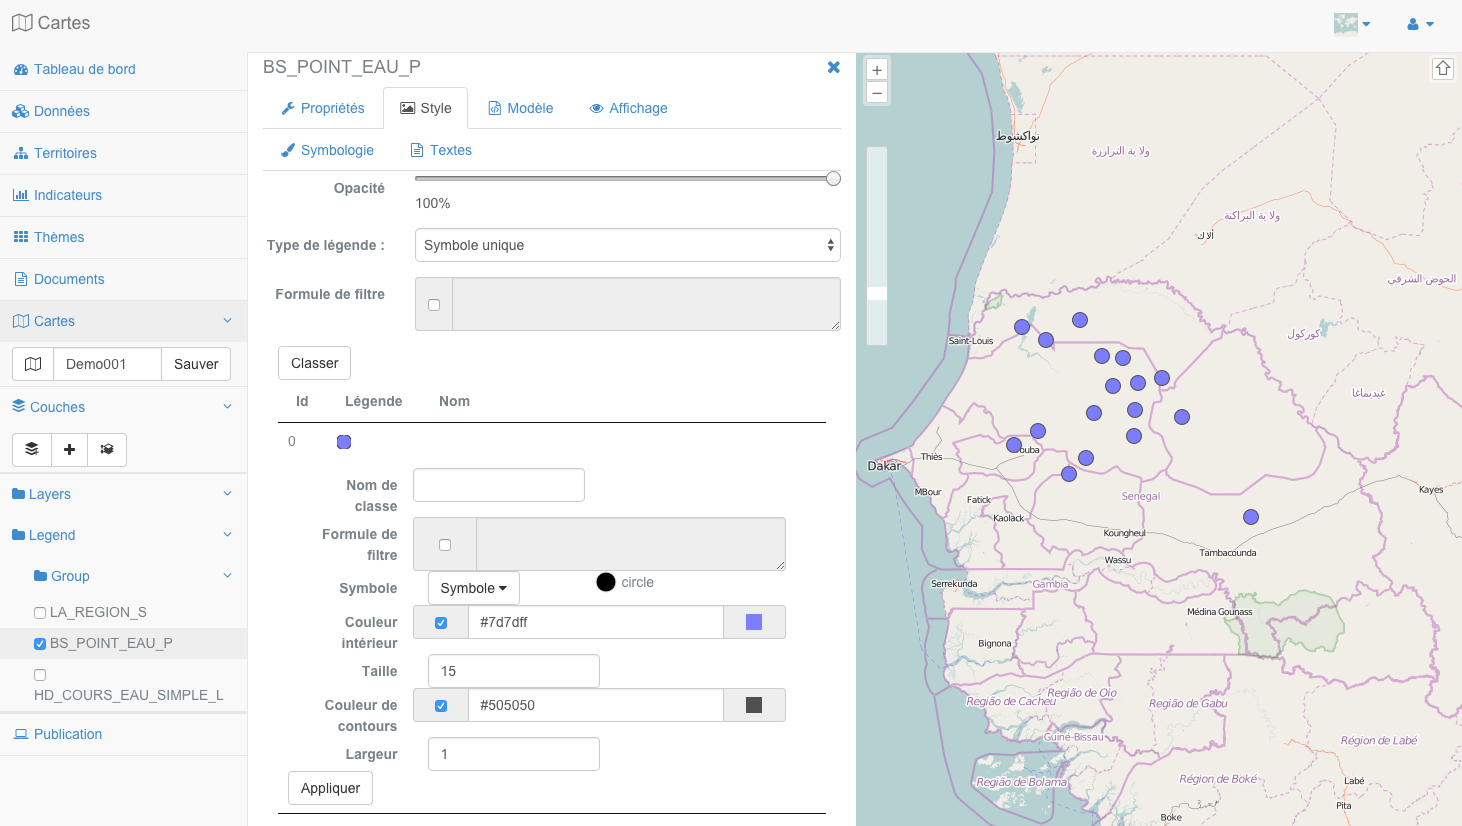
The same parameters as for the layers of polygons or lines are provided, except for the choice of the symbol ** and ** size which are parameters spécifiquex style points.
Note
filling options with a symbol or a hatched frame are not supported for point layers.
Setting the display of labels with a layer
You can view the label or not for a given layer using the form provided below. By checking the box you can enable the display of labels, you deactivate the clearing posting.
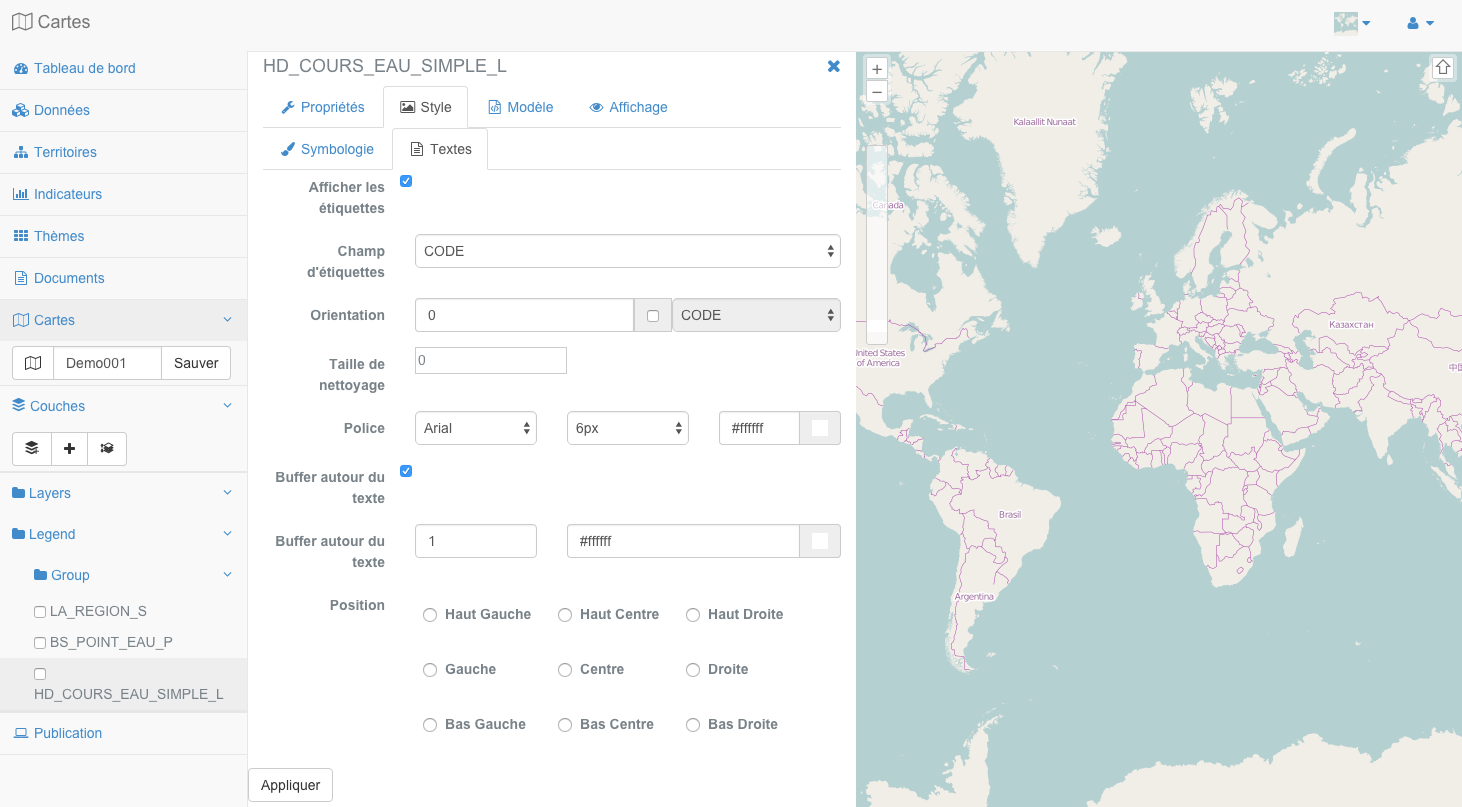
The parameters to enter are the following:
Field labels
The field used to create the label, it is the value that will be displayed on the layer entity on the map.
Orientation
The text displayed on entity may be oriented at an angel or manually defined, by ticking the box by using the value in a field in the table that you can select in the list provided for this purpose.
cleaning size
The text field to define the size of a buffer zone around a label displayed to ensure that no other tag will be displayed in this area.
Police
3 drop-down lists allow you to define the font to use, the font size and color.
Buffer around the text
This check box enables (or not) the creation of a buffer zone bordering the label text. This often provides a better rendering of labels. You can set the size and color of the area.
Position
The position allows to define where the label to be displayed in relation to the geographical entity to which it corresponds.
After the setup, you must click on the button “Apply” to save your changes, the display layer is then refreshed.
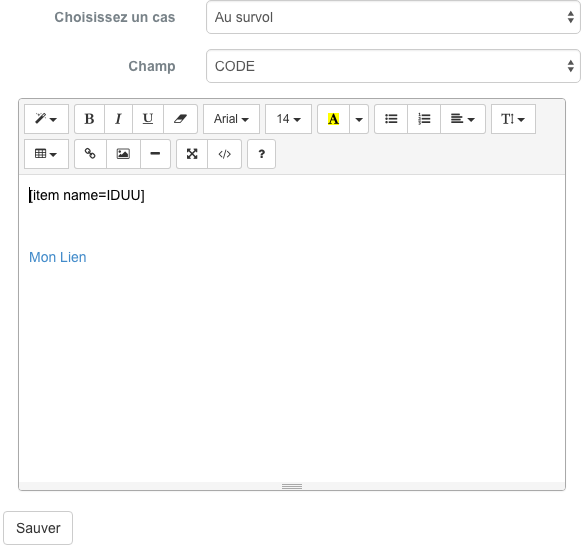
Setting the display of information of a layer
The gauge of a layer corresponds to the model used in the tool tip or overflight window or click on an entity of a layer in the published map.
Note
The bubbles of information and therefore the templates are to be used only on vector layers.
To configure the template of a layer, you must use the form provided below.
Mode ** text editor ** |
** Mode ** HTML editor |
 |
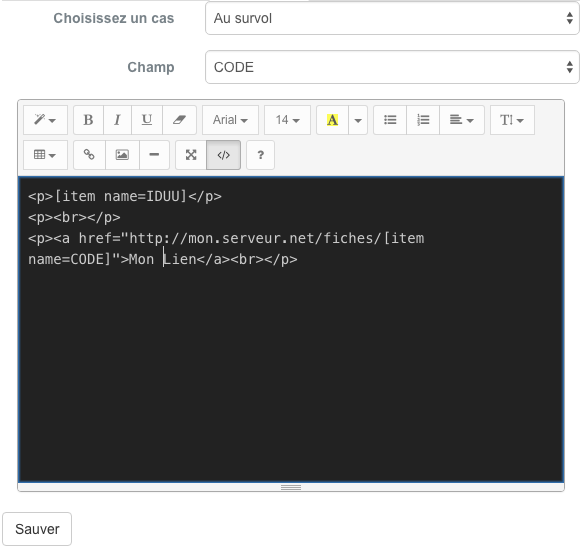 |
- First select a case of use available in the first drop-down list:
“In the overview” (The template is displayed in a tooltip on mouse over an entity of the layer)
“On click” (The template is displayed in an information window to click on an entity of the layer.
The second drop-down list for its fields present in the attribute table of the layer. The selection of one of the field names causes the writing of the chain, allowing a dynamic replacement with the value of the field for the entity Laquel the corresponding user selected in the editing area of the template below.
You have great freedom in writing the template and you can easily query fields in the attribute table. Once your prepared template, click on the “Save” button to save the changes. The success of the registration stipulated in a green band at the top of the screen.
Note
Switch to HTML editor mode by pressing the “Source” button on the top left of the toolbar of the template editor
Note
For more information about the features of the editor, please refer to the `Documentation CKEditor <http://docs.cksource.com/Main_Page> ` __
display scales with a layer
The setting scales displays a layer is made using the form provided below.
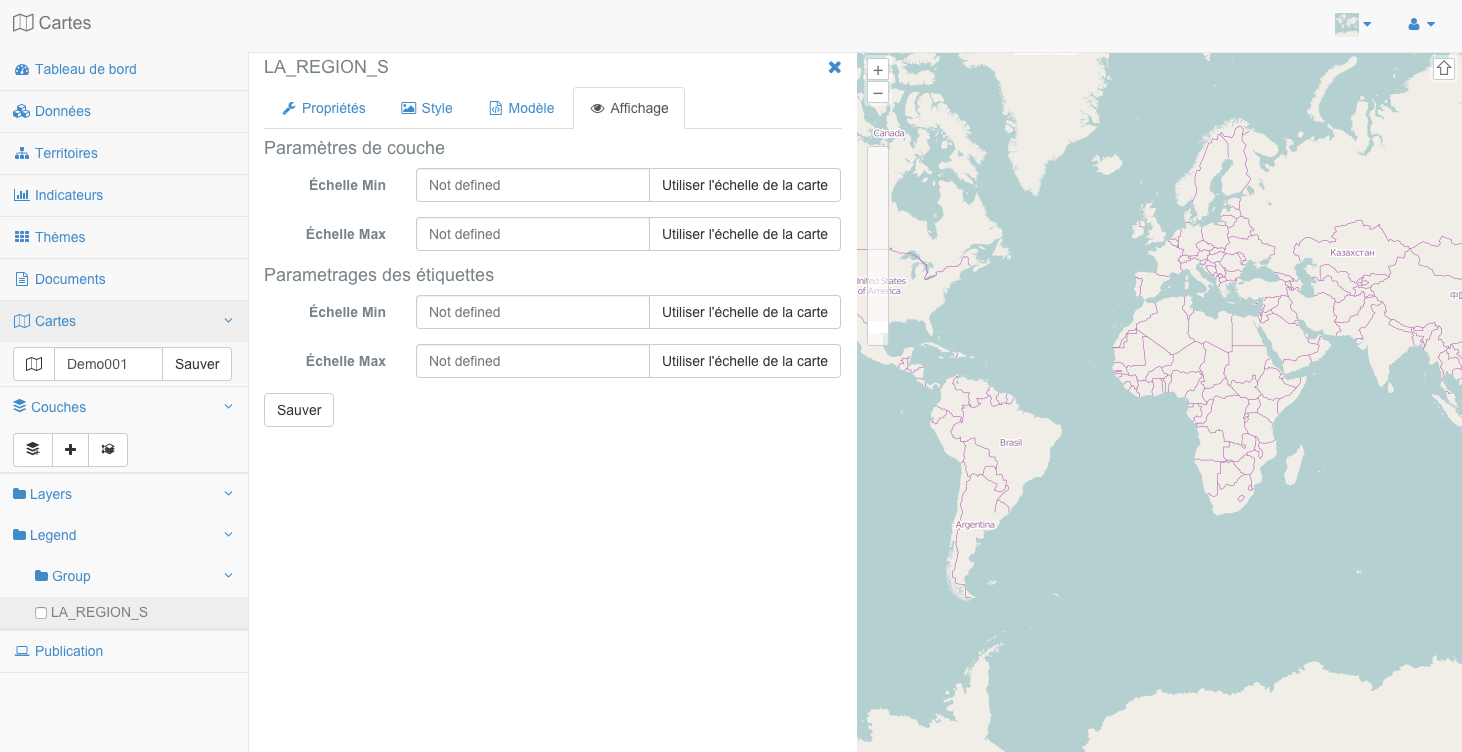
The settings for the display scale of a layer can be visually performed by the user. The current zoom level: doc: ../ maps / mapsviewer can be used to set the value at the click on the button” Use the scale of the map. “
** Scale Type ** |
Action |
| Min | Sets the current zoom level as minimum display of a layer |
| Max | Sets the current zoom level as maximum display a layer |
Removing a layer
To remove a layer of the card as the tree, click the right mouse button button on the layer name and click “Delete” from the popup menu.
Warning
Removing a layer of the board is final and also removes its symbology and properties